
Key Metrics and Experimental Test Bench for Assessing Highly Sensitive Magnetometers in Research
IEEE Sensors Journal, vol. 25, no. 2, pp. 2432–2455, 15 January 2025.
DOI: 10.1109/JSEN.2024.3491164PTB Berlin · Department 8.2 Biosignals
Reliable comparisons between magnetometers need well-defined test conditions and a common set of metrics. As an affiliate researcher at the Physikalisch-Technische Bundesanstalt (PTB) in Berlin, Germany’s national metrology institute, I characterize highly sensitive magnetometers in collaboration with its Department 8.2 Biosignals: from optically pumped magnetometers (OPMs), OPM-MEG systems and other quantum sensors such as NV centers to SQUIDs and emerging non-cryogenic magnetometers, including magnetoelectric (ME) sensors and magnetoresistive (xMR) sensors. The characterization takes place inside the Berlin Magnetically Shielded Room BMSR-2.1, on a dedicated non-magnetic testbench, and follows a framework of 15 parameters in six metric groups.
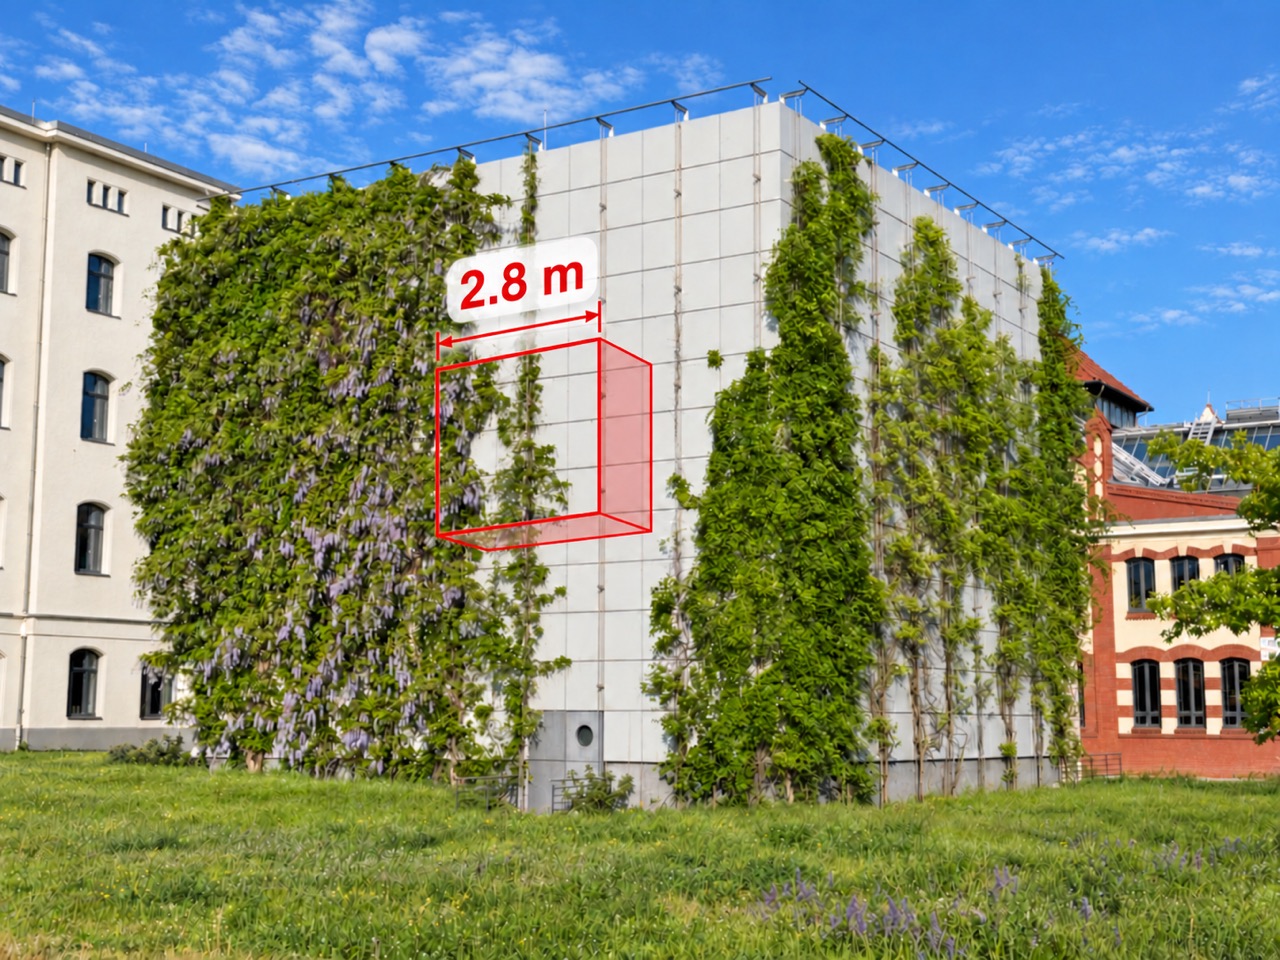
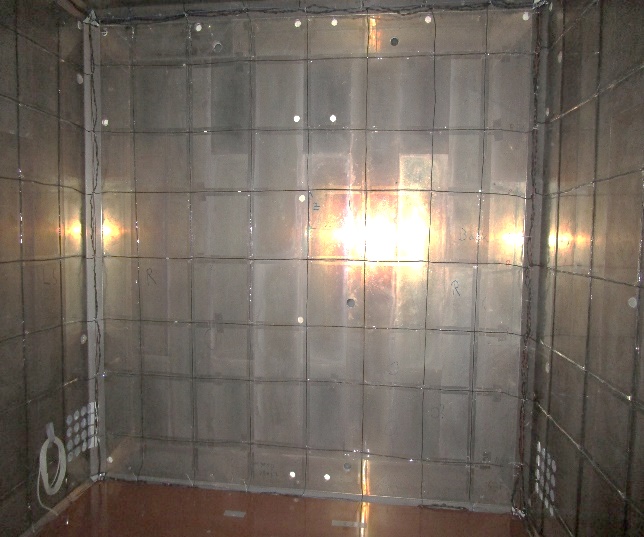
All measurements take place in the BMSR-2.1 at PTB Berlin. Since its conversion in 2020, the room consists of eight mu-metal layers and one RF layer. Careful degaussing is essential for reaching the low residual fields listed below.
The BMSR-2.1 is the best-shielded room in Germany and ranks third worldwide:
The prototype testbench was built by the sample workshop of PTB Berlin from non-magnetic materials and is mounted inside the BMSR-2.1. Named Device Alignment Actuator (DALAC), it positions single sensors and multichannel arrays at the center of the shielded room and rotates them about two 360° axes (α, β).
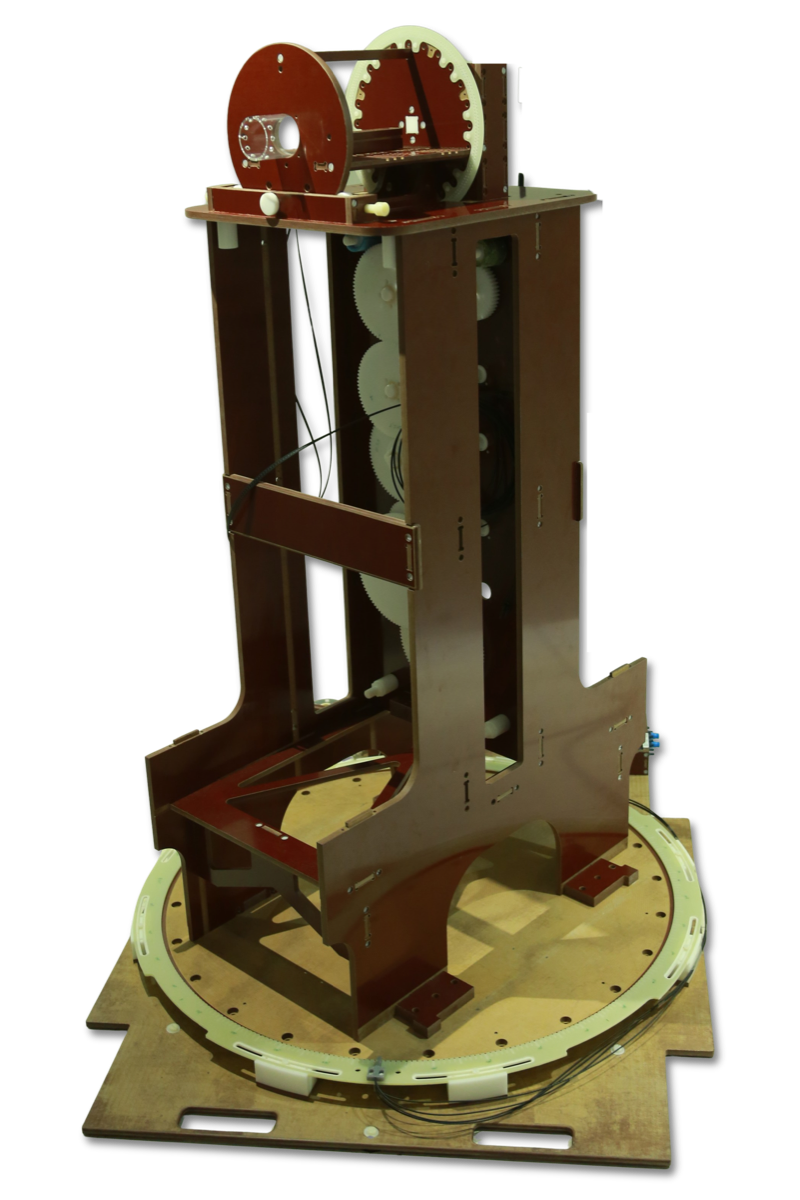
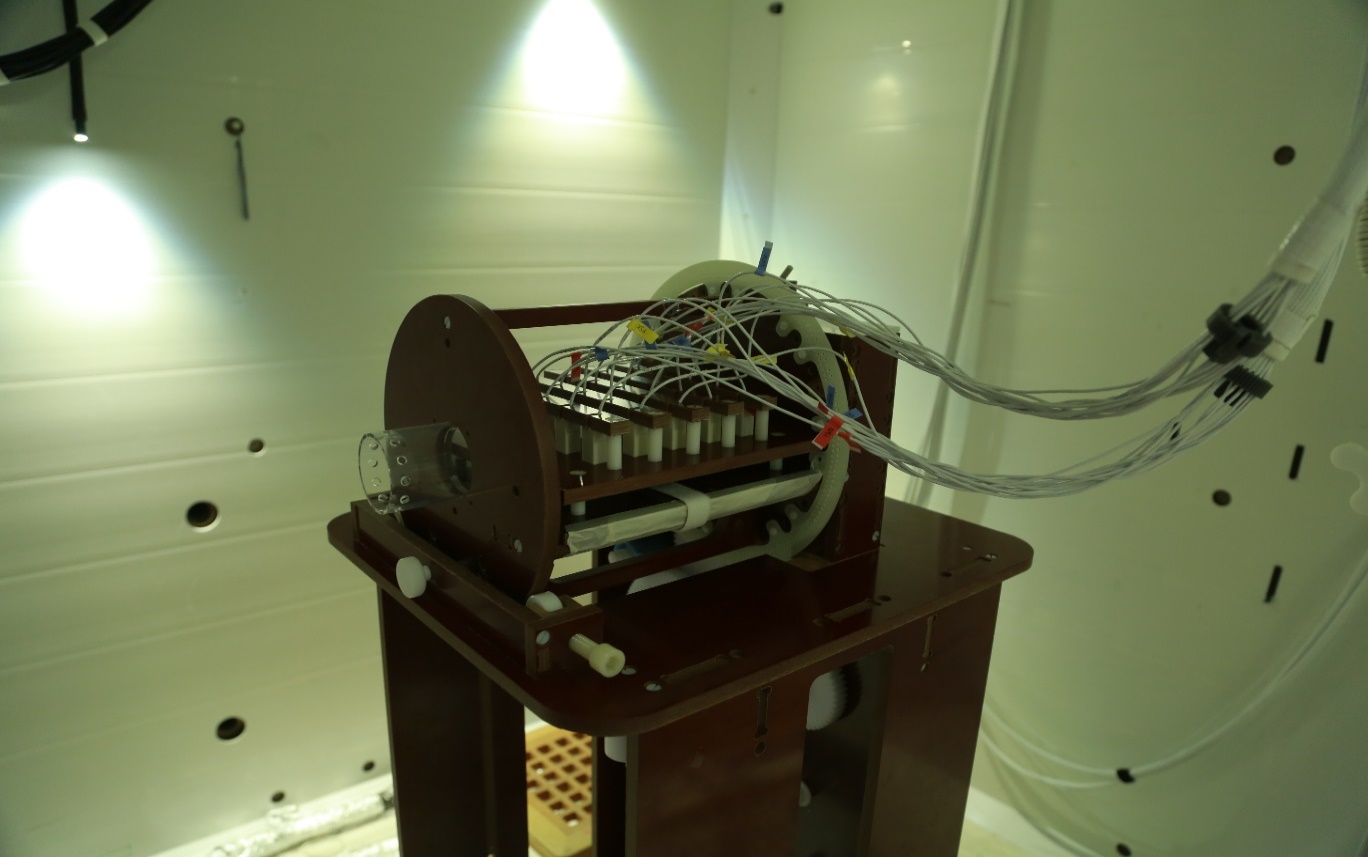
The testbench enables benchmarking of different sensor technologies in single-sensor and multi-sensor arrangements. The photograph at the top of this page shows SERF-OPMs of type FL v3 (FieldLine). Two further examples are given as an impression:
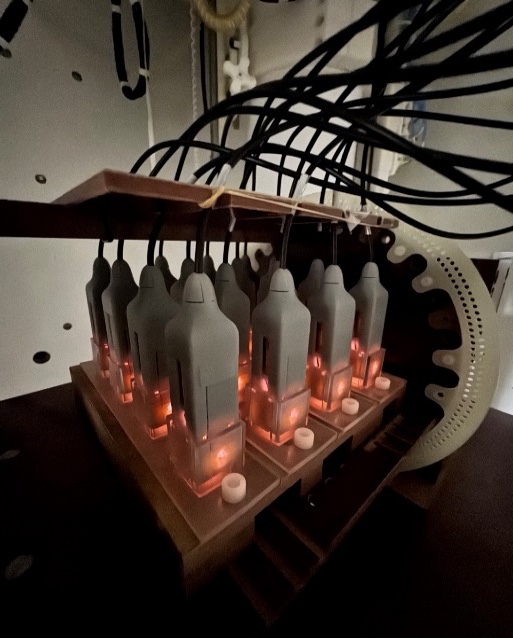
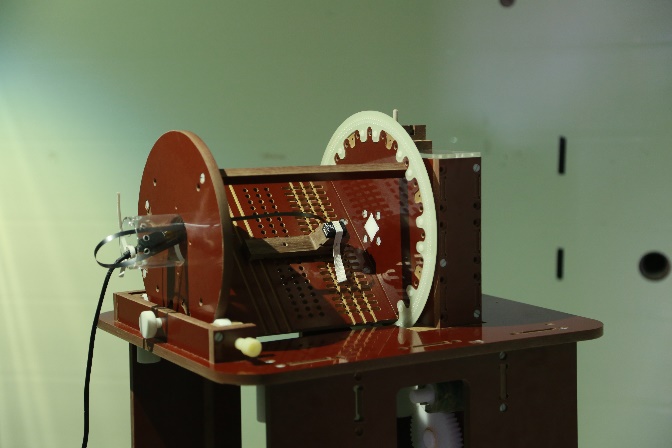
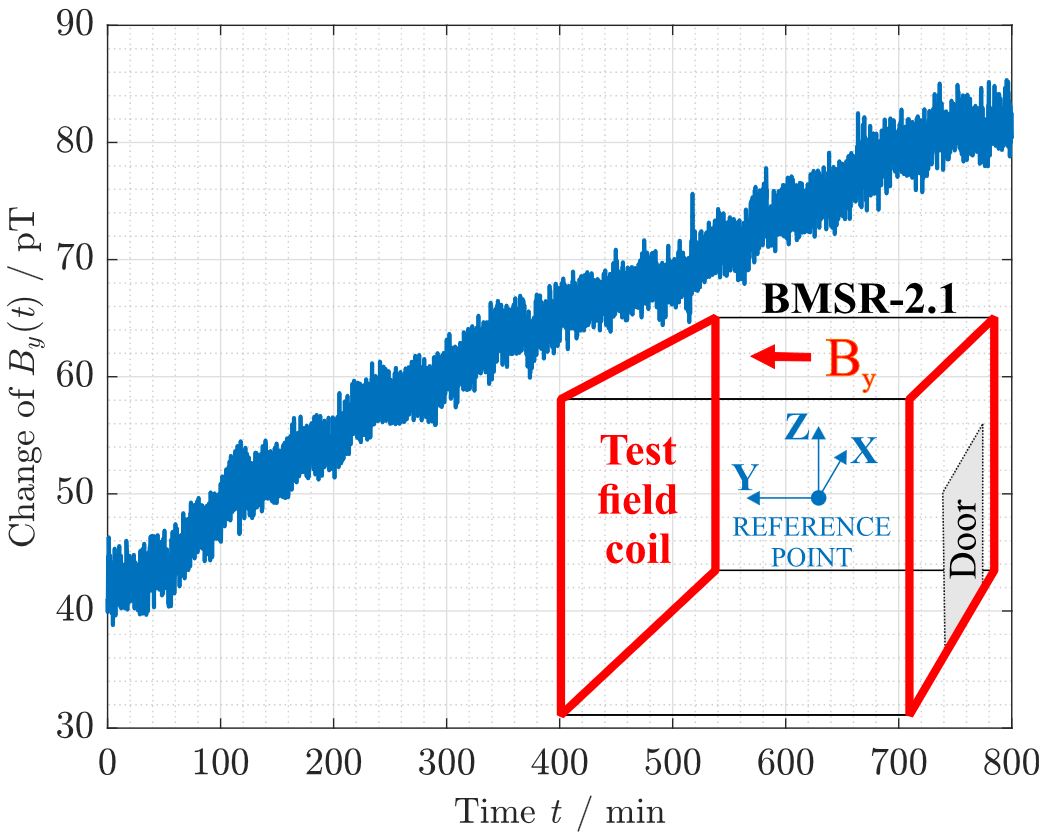
Test fields are generated with coils on the walls of the shielded room, driven by a low-noise current source with long-term stability. The resulting homogeneous field is well known and verified with SQUIDs. The back-action of the mu-metal is measured and taken into account.
DALAC, BMSR-2.1 and SQUIDs together are the key to multi-axis testing of ultra-sensitive multichannel magnetometers.
Every magnetometer is assessed with the same framework of 15 parameters, organized in six metric groups.
Biomagnetic fields decay steeply with distance. A magnetometer with higher intrinsic noise but smaller standoff can therefore detect signals that remain inaccessible to a lower-noise sensor positioned farther from the source. Yet magnetometer technologies are still compared mainly by their noise floor, while the source-to-sensor distance is rarely made explicit.
The minimum detectable signal (MDS) is a figure of merit derived from a rotating magnetic dipole model. It combines two properties that are usually reported separately: the standoff of a sensor and its intrinsic noise.
The distance r between source and detector is the outer distance R from the source to the case of the device under test plus the standoff rmin of the detector inside the case. The dipole field falls off with 1/r3 (far-field approximation, as model), so small changes in standoff can strongly affect detectability.
For a required signal-to-noise ratio SNR, a noise power spectral density SB and a bandwidth BW, the minimum detectable signal at the outer distance R follows as a magnetic dipole moment.
Fixing the conditions yields MDS20: one number under identical conditions, given in pAm2. The three reference conditions are the “20/20/20”: power spectral density at 20 Hz, 20 mm from the source to the case and SNR = 20 as a power ratio (≈ 13 dB).
Point to a condition to see where it enters the formula.
Enter the stand-off distance and the noise of a magnetometer to obtain its MDS20 and to compare its MDS(R) curve with the reference devices of the BIOMAG 2026 handout.
MDS20 of your sensor
pAm2
R = 20 mm · SNR = 20 · BW = 1 Hz
MDS(R) for the conditions above
pAm2
| # | Device / system | rmin [mm] | Noise ASD (typ. best axis) | MDS20 [pAm2] |
|---|---|---|---|---|
| 1 | SQUID (Research, SQUID-MEG, PTB) | 12.9 | 0.28 fT/√Hz 1 | 0.32 |
| 2 | SQUID (Research, Small SQUID, PTB) | 8 | 3.5 fT/√Hz | 2.43 |
| 3 | SERF-OPMs (Neuro-1, QuSpin) | 6.5 | 10 fT/√Hz 2 | 5.88 |
| 4 | SERF-OPMs (HEDscan, FieldLine) | 5 | 15 fT/√Hz 2 | 7.41 |
| 5 | SQUID (Research, VMS 304, PTB) | 28 | 2.5 fT/√Hz 3 | 8.74 |
| 6 | 4He-OPMs (MAG4Health) | 4 | 30 fT/√Hz * | 13.11 |
| 7 | SQUID-MEG (Commercial, CTF) | 20 | 7 fT/√Hz * | 14.17 |
| 8 | xMR (Nivio, TDK) | 15 | 0.8 pT/√Hz * | 1085 |
| 9 | MI Sensor (DJ, Aichi Steel Corporation) | 6.5 | 2.1 pT/√Hz * | 1236 |
| 10 | NV Center (Research, GSI & JGU Mainz) | 0.18 | 13 pT/√Hz 4 | 3.38 · 103 |
| 11 | Converse ME Sensor (Research, CAU Kiel) | 15 | 15 pT/√Hz 5 | 20.34 · 103 |
BW = 1 Hz · R = 20 mm · SNR = 20 (13 dB). Values from the BIOMAG 2026 handout, doi:10.38071/2026-01501-6. * Reported values. 1 Storm et al., doi:10.1063/1.4976823. 2 Elzenheimer et al., doi:10.1016/j.measurement.2025.120140. 3 Elzenheimer et al., doi:10.1109/JSEN.2024.3491164. 4 Omar et al., doi:10.48550/arXiv.2601.18843. 5 Elzenheimer et al., doi:10.1109/JSEN.2023.3237910.
Standoff dominates. This favors low-standoff sensors such as OPMs, despite their higher noise floors.
Noise performance dominates. This favors low-noise sensors such as SQUIDs.
A lower MDS20 means better source detectability, which makes MDS20 a guide for sensor selection. In a real application, the sensor ranking depends on the source model and the source depth.
The testbench, the metric framework and the minimum detectable signal are described in detail in the following open-access publications:
IEEE Sensors Journal, vol. 25, no. 2, pp. 2432–2455, 15 January 2025.
DOI: 10.1109/JSEN.2024.3491164Measurement, vol. 263, 120140, 3 March 2026.
DOI: 10.1016/j.measurement.2025.120140BIOMAG 2026, 23–25 August 2026, Beijing, China.
DOI: 10.38071/2026-01501-6Research collaboration
I welcome collaborations that start from a research question:
Evaluations are carried out as research collaborations with the aim of a joint publication.